
Bungee Drop
Test Data
69 drops with different masses and cord lengths.
Select a point to read the measurement.
Loading measured drops…
Drag to orbit · Scroll or pinch to zoom · Select a point for details
The plot shows the 69 measurements in the May CSV. Color indicates cord length. This is the measured data, without a regression surface.
Source fields: drop_length → cord length (m), drop_mass → mass (kg, displayed as g), stretch_length → stretched length (m). The CSV does not specify units. The length units and the interpretation of drop_length as cord length are based on the report.
Data Table
| drop_length | drop_mass | stretch_length |
|---|---|---|
| 2 | 0.3007 | 5.0419 |
| 2 | 0.3527 | 5.3594 |
| 2 | 0.4002 | 5.64515 |
| 2 | 0.4521 | 5.86105 |
| 2 | 0.5 | 6.15442 |
| 2 | 0.5498 | 6.41604 |
| 2 | 0.602 | 6.63194 |
| 2 | 0.25 | 4.87553 |
| 2 | 0.2049 | 4.572 |
| 2 | 0.1479 | 4.0767 |
| 2.5 | 0.3042 | 5.7404 |
| 2.5 | 0.3498 | 5.9563 |
| 2.5 | 0.399 | 6.1722 |
| 2.5 | 0.4524 | 6.5151 |
| 2.5 | 0.5048 | 6.84276 |
| 2.5 | 0.5506 | 7.00532 |
| 2.5 | 0.6021 | 7.2644 |
| 2.5 | 0.2546 | 5.52196 |
| 2.5 | 0.203 | 5.23748 |
| 2.5 | 0.1511 | 4.7117 |
| 3 | 0.3024 | 6.1722 |
| 3 | 0.3544 | 6.54812 |
| 3 | 0.4015 | 6.7945 |
| 3 | 0.4492 | 7.04342 |
| 3 | 0.497 | 7.366 |
| 3 | 0.5485 | 7.5946 |
| 3 | 0.2473 | 6.0198 |
| 3 | 0.1991 | 5.5499 |
| 3 | 0.1529 | 5.1943 |
| 3 | 0.0984 | 4.7498 |
| 1.5 | 0.3955 | 4.92252 |
| 1.5 | 0.4548 | 5.2324 |
| 1.5 | 0.5005 | 5.4356 |
| 1.5 | 0.5495 | 5.72262 |
| 1.5 | 0.6013 | 6.0833 |
| 1 | 0.4539 | 4.5085 |
| 1 | 0.5057 | 4.699 |
| 1 | 0.55333 | 4.8895 |
| 1 | 0.6006 | 5.1181 |
| 3.5 | 0.298 | 6.92 |
| 3.5 | 0.3461 | 7.12 |
| 3.5 | 0.4003 | 7.435 |
| 3.5 | 0.449 | 7.635 |
| 3.5 | 0.5068 | 7.96 |
| 3.5 | 0.55 | 8.21 |
| 3.5 | 0.2523 | 6.64 |
| 3.5 | 0.2032 | 6.3 |
| 3.5 | 0.1516 | 5.915 |
| 3.5 | 0.1002 | 5.35 |
| 4 | 0.2985 | 7.57 |
| 4 | 0.3526 | 7.867 |
| 4 | 0.3987 | 8.18 |
| 4 | 0.2494 | 7.25 |
| 4 | 0.198 | 6.85 |
| 4 | 0.1497 | 6.44 |
| 4 | 0.0992 | 5.895 |
| 4.5 | 0.3012 | 8.25 |
| 4.5 | 0.2498 | 7.928 |
| 4.5 | 0.2029 | 7.52 |
| 4.5 | 0.1507 | 7 |
| 4.5 | 0.0996 | 6.57 |
| 5 | 0.3057 | 8.8 |
| 5 | 0.201 | 8.17 |
| 5 | 0.1519 | 7.58 |
| 5 | 0.1016 | 6.94 |
| 5.5 | 0.1485 | 8.12 |
| 5.5 | 0.0995 | 7.65 |
| 6 | 0.0995 | 7.86 |
| 6 | 0.1506 | 8.57 |
For Science Olympiad’s 2025–2026 Bungee Drop event, I built and tested a cord system for masses from 50 to 600 grams and drop heights from 5 to 10 meters. The task was to choose a cord length that would bring the mass close to the floor without hitting it. I collected test data and used polynomial regression to estimate that length.
The Device
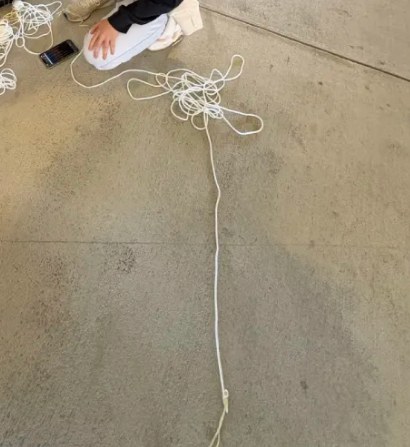
The device combines about 5 meters of paracord with a doubled 50 cm length of flight rubber. A keyring holds the test mass, and knots reinforced with UV-set resin secure the connections. Using a short elastic section kept replacement costs down: the rubber needed replacing after roughly five drops, while the paracord could be reused. The design also aimed to reduce variation by limiting the amount of elastic in the system.
Testing and Data Analysis
Testing every combination of mass and height would have required far too many drops. I sampled at roughly 50 gram and 50 cm intervals, then used polynomial regression to estimate the cord length needed between test conditions. The graph above shows the 69 measurements in the May dataset, rather than the fitted model. Rubber wear, temperature, and humidity remained sources of variation that a prediction based on earlier tests could not fully account for.